Occupancy Management
The R Com Occupancy management system enables businesses and organisations to accurately monitor footfall and manage flows within their locations, allowing for an unprecedented level of business optimisation, health & safety and smarter, data-driven decisions.
The R-Com Occupancy Management System is an IoT solution used for counting, tracking and managing people entering and moving within premises.
The solution is based on our highly accurate VT Footfall counting software combined with other R Com VT IoT devices such as LED information displays and LED ‘Traffic light’ units and additional camera units.
These sophisticated and automated tools will help to save money, gain valuable analytics & key performance indicators, improve visitor/customer experience, influence behaviour, improve safety and optimise your operations.
Our Occupancy Management systems not only measure footfall and count people but can be set up and calibrated to monitor queues, manage social distancing requirements, display occupancy numbers, track shoppers around stores, highlight most visited areas, log visitor numbers and provide marketing data. The technology provides the basis for many projects & applications in retail, leisure and public sector facilities.
Why use Occupancy Management Sensors?
The real time & time stamped, 24hr base data provided by the R- Com VT Occupancy Management System can provide invaluable data to manage footfall and visitor traffic within busy, public locations.
The solution is particularly effective in managing queues and controlling numbers where social distancing or safety limits must be maintained.
Understanding the quantity, frequency and behavior of visitors within very specific locations, in real time can give invaluable insights for retailers, planners and businesses.
The solution is also ideal for collecting baseline historical data to provide accurate business case support before any projects are undertaken. This can be used in conjunction with more traditional ‘clip board ‘surveys and interviews which can be better targeted and designed using the highly accurate base data provided.
The data can also be used as before / after impact analysis to demonstrate return on investment following the implementation of customer / visitor marketing, infrastructure & process initiatives.
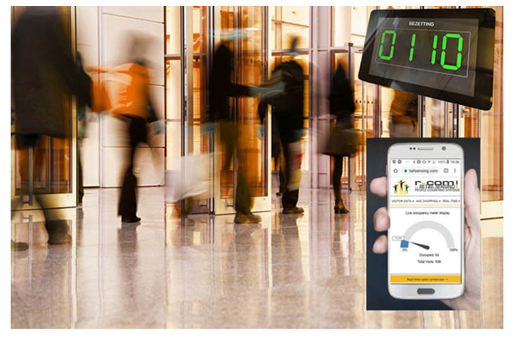
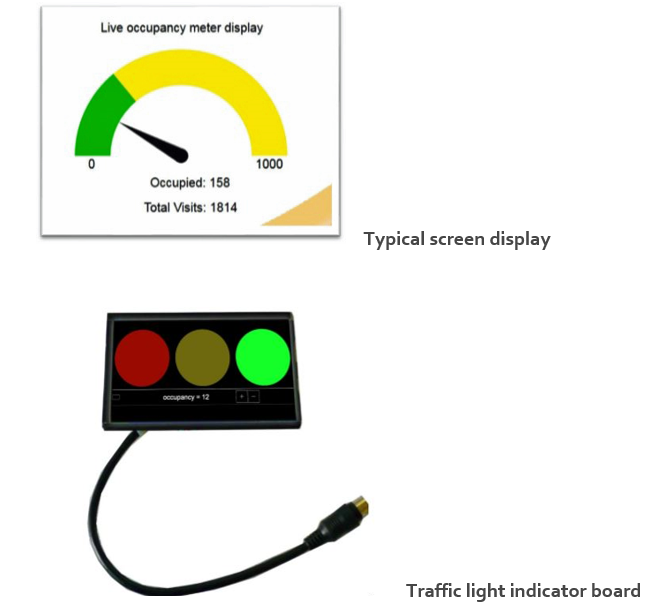
- Delivers real time people counts on a virtual occupancy meter presented on on smartphone or computer.
- Receive administrator texts alerts when occupancy / queues approach capacity limits.
- Monitor in real time Occupancy / Capacity.
- LED Occupancy Screens display real time footfall & occupancy counts inside/outside premises and other locations
- Display occupancy meters / information displays on premise. These flash an alert when nearing maximum capacity.
- Automatically informs customers of real time occupancy levels, wait times and alerts when social distancing/ occupancy limits are breached
- Identify & manage security / health & safety / ocial distancing issues and evaluate best practice
- Manage overcrowding / bottlenecks/Capacity limits.
- Control and adhere to maximum capacity limitations/regulations .
- Reduce and manage queues ( see below)
- Provides invaluable customer behavior, marketing and commercial data upon which decisions can be made
- Monitor the impact of promotions, events & crowd management strategies
- Detect & record how long people spend in one place and how often that place was visited, for example: product displays, promotions, toilets, car parks, information boards, public buildings / public spaces.
- Test the popularity of new facilities / features through before and after comparison.
- Measure frequency and volume of footfall at different times of day in order to more effectively plan & position related resources
- Improve scheduling at busy times of day and peak visitor / commuter periods
- Identify optimal opening / closing times and peak periods.
- Support the case for negotiating Business Rates and rents through accurate footfall data.
Some typical applications and scenarios
Many different types of businesses and activities find it useful to count and track the number of people within their locations such as: shopping centres, retail chains, office blocks, museums, libraries, other public buildings, sporting venues, exhibition centres, theme parks, banks, hotels, bus & train station, restaurants and so on.
Companies can compare occupancy levels and queuing times across bank branches, retail stores and departments, and help managers plan for when to perform tasks like restocking shelves and when focus staff on looking after customers. It also provides managers with data to plan resources at busy periods or revise layouts.
Retailers gain many insights from counting visitors within stores. With accurate figures for sales conversion rate, dwell times, queuing times, popular store areas and other indicators, retail managers take informed steps to improve sales. Our experience shows that sales can be increased without any increase in store traffic.
Health and Safety can be enhanced by knowing who is in a building, where they are and when they entered/ left the premises. An unexpected consequence of the coronavirus outbreak has been the need for effective occupancy management, social distancing and queuing / footfall flow systems.
Exhibition Centres need accurate real-time occupancy and footfall figures to ensure conference and exhibition centres run more efficiently and can be managed to get the optimum use of the centre for the benefit of exhibitors and visitors.
Libraries and museums are reaping rewards from the deployment of visitor counters. They are using them to save money, improve services, determine how the facilities are being used and, increasingly, to justify their existence.
Airports and other public facilities can use the technology to monitor and manage security queues and manage resources at peak periods.
Queue management
Long queues affect a customer’s in-store experience and can hurt sales as frustrated shoppers forgo a purchase or decide not to return. The Occupancy Management Queue monitoring feature enables staff to react in real time to growing queues thereby improving customer experience
The system will also run over the course of a day, provide statistics about queue duration and queue fluctuations for a store over the course of the day, month or year helping to plan layouts, till capacity and staffing levels accordingly.
Statistics on average queue lengths can help you determine how many staff members you should have on certain days and at certain times, leading to better planning and more cost-effective staffing.
You can also set the queue thresholds to prompt the opening of a new line or cash register when the number of people in a line-up exceeds the limit.
The queue management system gives you the information you need to understand which measures can reduce queues, and which are the most profitable by reporting the following:
- Number of people currently in a queue.
- Queuing time of the last person to leave the queue.
- Number of active service points (for example ticket booths or retail checkouts open).
- Average queuing time. How many people left the queue before reaching the front.
- Incidence of queue jumping.
- Average queue length.
- How often more than five (for instance) people were in the queue.
- Daily figures, for example, 95% of people queued for less than 5 minutes.
How does queue management work?
Camera units with sophisticated software and data processing capability are mounted above entrance doors and key locations around the premises such as tills, kiosks and marketing displays. Data is transmitted to a central Cloud based database where data from each of the locations can be used to generate reports showing the historical trends and allowing the user to do comparisons and integrate with sales data for sales conversion analysis.
Administrators can log in to the system and view reports anytime / any place or export the data to another business system.
Overhead CCTV cameras are linked to people counting units. The system updates queue length and current waiting time every minute and displays it on administrator screens or screens within the premises.
For queuing over a large area, several cameras are connected to together. With our queuing information system, managers can test different strategies to reduce queuing times. As queuing data can be integrated with a POS (point-of-sale) system, retailers can check whether reducing queues not only makes for happier customers but also increases sales.
Monitoring queues is not just useful for retailers. Airports and public facilities, for example, use video queue monitoring to see how long people are waiting to go through security, and banks improve their service by measuring queue lengths.
Predicting Queues: The number of visitors at different times is often surprisingly constant. A business that is very busy on Friday at 4 o’clock will likely be busy at that time every Friday. With a historic record of footfall and queue lengths throughout the day, businesses can predict when more staff are needed to help customers. On a shorter timescale, knowing how many people entered a store 15 minutes ago makes it easy to predict how long the queues will be.
For further details and full technical specifications please contact us.